So you’ve just got your SAT practice score report after taking a practice SAT with Ashland Prep. How do you make sense of it all?
The video above gives you the basics in about two minutes. I recommend full-screening it so you can see what my cursor is pointing at — one of these days I’ll make a higher tech version of this video! If you want even more details about reading a score report, read on. Or, reach out to ravi@ashlandprep.com to get a custom analysis of your personal score report.

The Total Score is your overall score, added up between two sections: Math and Reading and Writing.
In Math, there are two sections: Math with No Calculator and Math with Calculator. The calculator math section is longer and may be more difficult for students. This is likely because:
1). It’s longer.
2). It’s at the end of the exam when you’re super tired.
Reading and Writing is a combination of two different sections that test different things. Reading tests reading comprehension. Writing and Language tests grammar and writing fundamentals.
In this student’s case, he scored 730 out of a possible 800 on Reading and Writing, and 700 on math out of a possible 800. The total possible maximum score is 1600. The total minimum score is 400. Yep — you get points just for writing your name.
To get the score of 730, you add up the Reading subscore of 37 to the Writing and Language subscore of 36. 37+36=73, x 10 = 730.
For Math, it’s similar — you take the 35 subscore and multiply that by 2 to get 70, multiply that by 10 to get 700.
Why do they go through all these steps to get that 1600 score? The simple reason is that it’s marketing. The 1600 scale is a measure that most parents and school administrators can digest, because that was the scale when they took the test. However, there’s a practical reason in this case: the 1600 scale allows the SAT to weigh the math score equally in comparison to Reading and Writing.
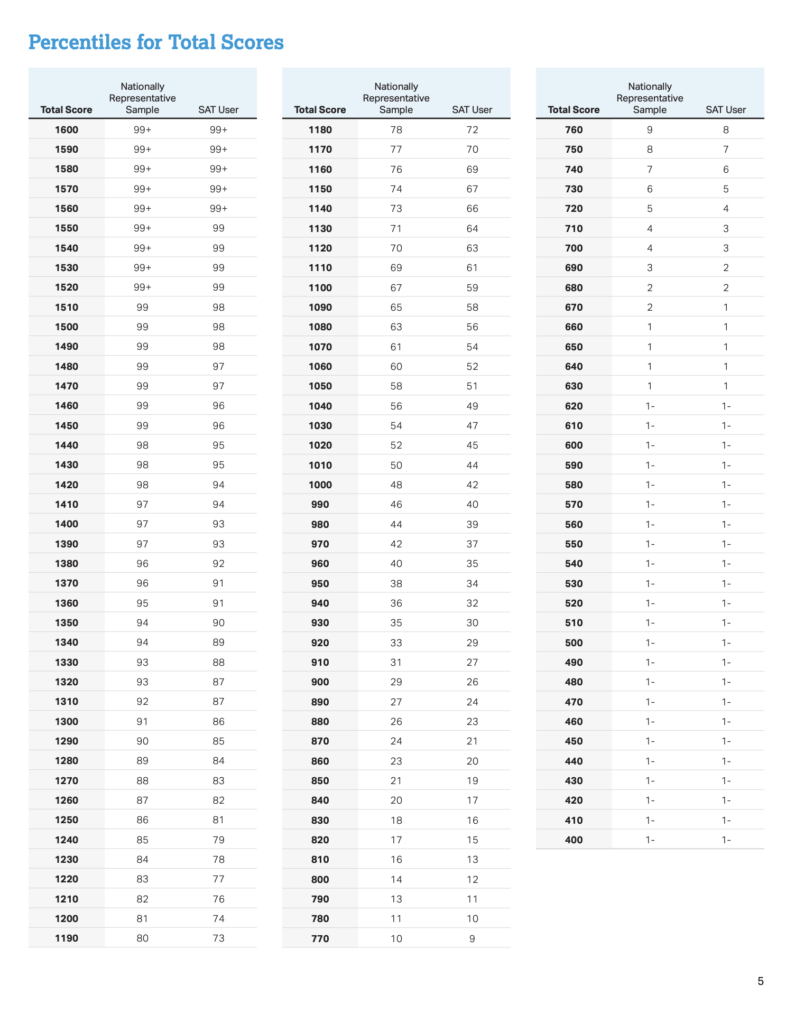
What is a percentile?
Let’s say you’re in a room full of 100 kids anywhere in the country. These 100 kids are taking the SAT, and they represent the average student you’ll see at any high school.
If you score 1500 on the SAT, you’re likely in the top two students in the room. You’re beating 98 of those kids on average.
If you score 1100 on the SAT, you’re beating roughly 50 of those kids. In fancier words, you’re in the “50th percentile.” The SAT isn’t as transparent about their percentiles as the ACT on an individual test, which is why our score reports don’t post them. That said, you can check out a rough percentile chart directly from the College Board below:
If you’re a high scoring student, you shouldn’t stress about trying to achieve a score above a 1500. Beyond that point, there’s an element of luck and you’ve proven you know your stuff.
Now let’s take a look at this student’s individual sections. If you scroll down the PDF of your score report, you should see these pages as well.
Section 1: Reading
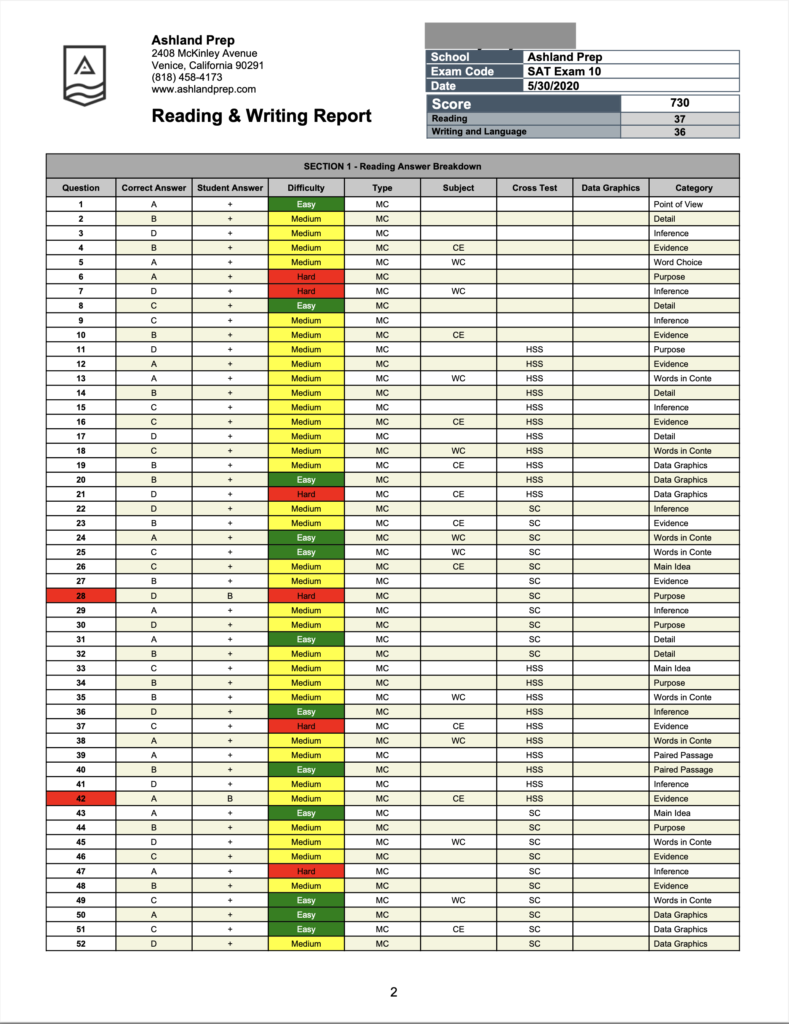
In this test, the curve was extremely rough. This student got only two questions wrong on Reading and two on Writing, yet he only scored a 730. In many cases, four total questions wrong on Reading and Writing equates to 770.
To me, this is why the SAT can be problematic for high scoring students. You can do extremely well and, through no real fault of your own or true lapses in knowledge, your score can fluctuate multiple percentile between tests. I can’t speak to whether the SAT has gotten better at this — I just know that even in their own official SAT test book there are wide fluctuations in raw vs. scaled scores in the top percentile of scorers. This is why, if all is equal between a high-scoring student on the SAT and the ACT, I would steer them towards the ACT. On the ACT, there can also be variation in raw scores (total number of questions correct) that yield scores in top one percentile, or 34-36 range. But rarely, if ever, does getting two questions wrong on any section of the ACT drop you below the top 1 percentile.
This student got unlucky on this particular exam. However, with the fluctuations in raw to scaled scores on the SAT, this student could easily get unlucky again.
Section 2: Writing
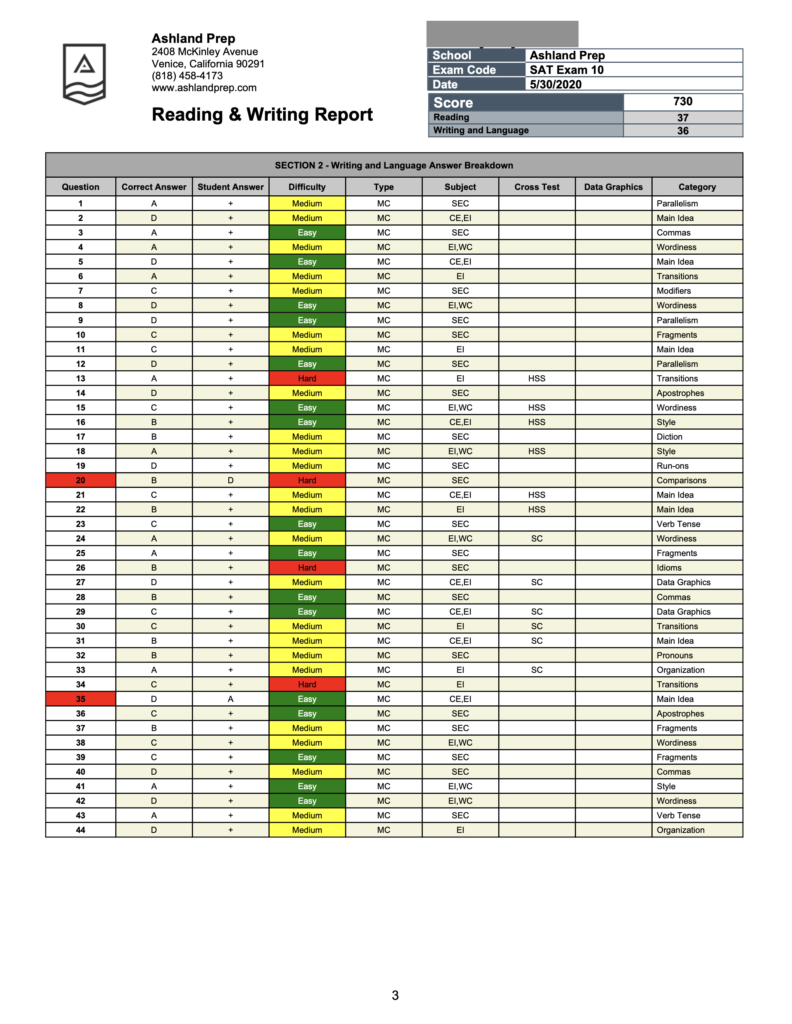
Again, this student performs extremely well and should generally be considered a 750+ SAT reading and writing student. He just got unlucky with the curve. However, this student did miss one question the SAT considered “easy.” Given the rest of his score report here and the success he had, he likely made a careless error and would likely get this question right easily the second time around. Since this student is a particularly high scorer, he should really scrutinize the question he got wrong that the SAT considers hard.
Section 3: Math (No Calculator)
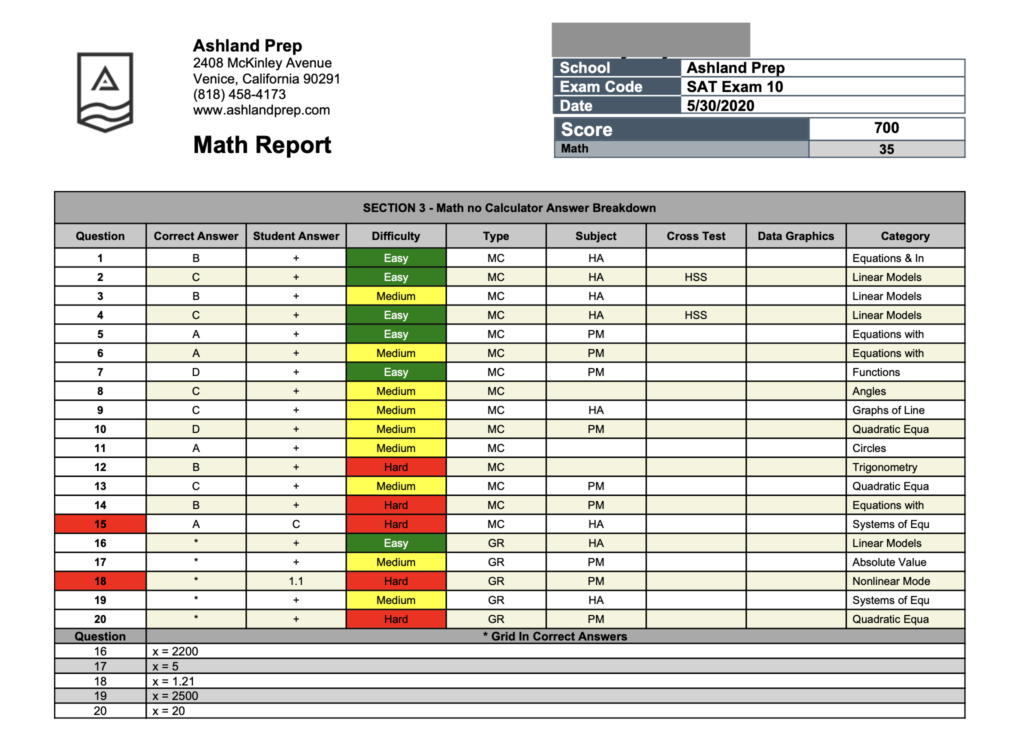
On this section, this student demonstrates remarkable consistency. making no careless mistakes on easy and medium problems and getting only two questions wrong — both considered “hard” by the SAT. On these exams, students doing problems with this much accuracy should be extra diligent in understanding how and why they got particular questions wrong. Was it misreading? A careless error? A concept you didn’t understand?
Math with Calculator
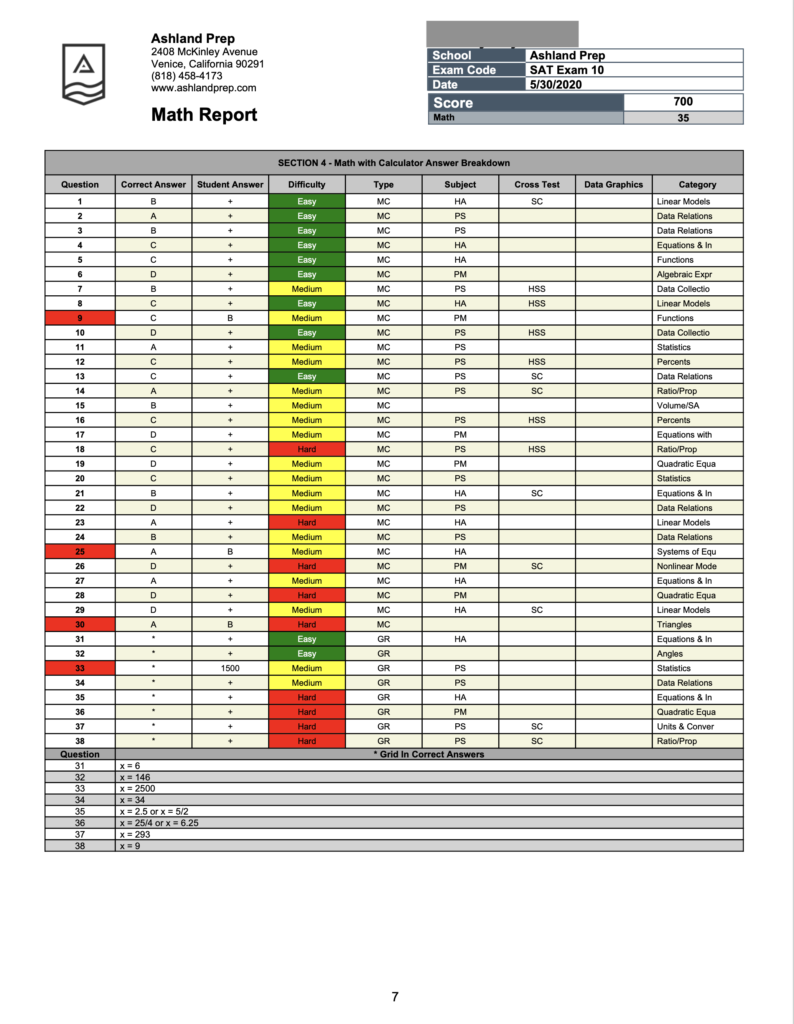
On the second math section with calculator, this student gets three medium questions wrong and one hard question wrong. If you look at the column on the furthest right, you will notice that the test describes the different subject matter that each problem covers. In this case, there’s no particular pattern or repetition in the types of questions he got wrong. However, no pattern is still a pattern! Since this student’s missed questions seem to come at random, and since three of them were medium-level questions (a difficulty he breezes through), I can deduce that this student likely missed these questions due to misinterpretation or misreading rather than a conceptual misunderstanding of the math. Simply put, he’s proven he knows his stuff.
Both math sections on the SAT are organized generally from easiest to hard, with medium problems scattered in between the two extremes. When you get to the grid-ins, the difficulty meter restarts itself: the first grid-in is relatively easy and the last handful are medium/hard.
Again, the curve of this particular exam hurt this student. Generally speaking , six questions wrong on math in total could yield scores around the 740 range. If the student had taken the SAT on a different day, his score could have been a 1500+ with the number of questions he got wrong on both verbal and math. Again, this is why I do not trust the SAT for high scoring students if the student scores similarly on both SAT and ACT practice tests. That said, the scores in the middle 50 percentile likely don’t fluctuate too much, so if you’re a middle-tier testtaker simply stick to the test you like the most and score the best on in comparison to each other on practice tests.
In this post, we:
1). Reviewed the structure of the SAT and how it’s scored.
2). Broke down this individual student’s score report by section.
3). Used the data to show why the SAT can be weird and sort of unfair sometimes to high-performing students.
If you’d like an analysis like this of your score report, please reach out to ravi@ashlandprep.com.
Until next time,
Ravi
Ashland Prep